S3 E5 : SUPPORT AND RESISTANCE EXPLAINED VISUALLY
“The Bouncing Ball Logic That Every Trader Must Know”
🏀 Imagine This:
You throw a ball toward the floor.
It hits the ground and bounces up.
Then it hits the ceiling and comes down again.
It keeps bouncing between the floor and the ceiling.
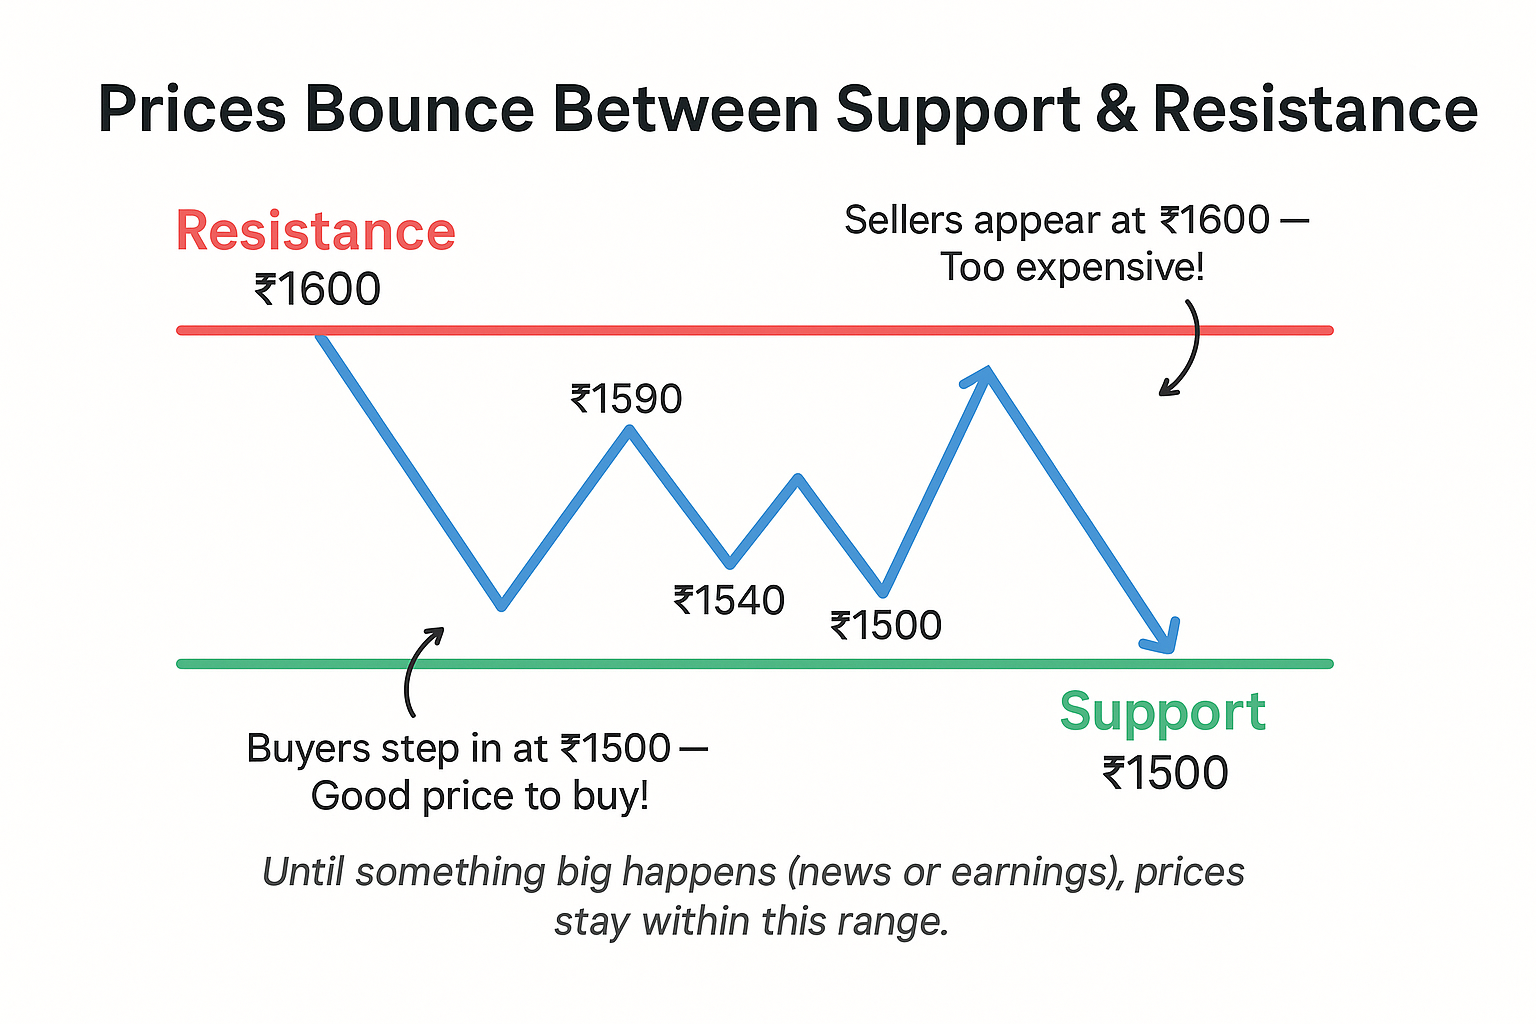
In trading, prices bounce the same way.
🔵 What is SUPPORT?
“The Floor That Holds the Price”
Support is a price level where a stock usually stops falling and starts rising.
Like the ground where the ball bounces up.
🧠 Example:
If Tata Motors keeps falling but always rises near ₹700,
then ₹700 is the support.
Buyers step in at this level.
They say: “This is a good price — let’s buy!”
🔴 What is RESISTANCE?
“The Ceiling That Stops the Price”
Resistance is a level where a stock usually stops rising and starts falling.
Like the ceiling where the ball hits and comes down.
🧠 Example:
If Infosys rises again and again but always gets stuck at ₹1,600,
then ₹1,600 is the resistance.
Sellers show up.
They say: “Too expensive — let’s sell!”
📦 Real-Life Example: HDFC Bank
Let’s say:
-
Support = ₹1,450
-
Resistance = ₹1,550
Every time the stock falls to ₹1,450, it bounces up.
Every time it rises to ₹1,550, it falls back.
Now traders set up their trades:
🟩 Buy near ₹1,450 (Support)
🟥 Sell near ₹1,550 (Resistance)
Some even trade just between these levels!
❓Can Support & Resistance Break?
Yes!
When the ball jumps too hard, it can:
-
Break the ceiling (Resistance) → Then that becomes the new support
-
Fall through the floor (Support) → That becomes the new resistance
Traders call this a breakout or breakdown.
🧠 Recap:
✅ Support = Price level where buyers stop the fall (floor)
✅ Resistance = Price level where sellers stop the rise (ceiling)
✅ Prices bounce between these levels — like a ball
✅ Breakouts can flip roles (old resistance becomes new support)
✅ This is how traders decide when to buy and when to sell